View CCM dashboards
Dashboards are a collection of charts and data tables with filters that you can use to get at the data you are interested. Dashboards serve as a platform for data modeling and analytics using a combination of available business metrics and operational data. You can use this data to make data-driven, informed business decisions.
For information on core Dashboard functionality, go to Create Dashboards.
We have deprecated the Dimensions Current CPU/Memory Avg(%), Current CPU/Memory Max(%), Current CPU/Memory Min(%) and introduced new Measures Average CPU Utilization (%), Minimum CPU Utilization (%), Maximum CPU Utilization (%), Average memory utilization percentage, Maximum memory utilization percentage, Minimum memory utilization percentage in Azure VM Inventory metrics.
Harness provides pre-loaded By Harness (pre-defined) and Custom (user-defined) dashboards to visualize cloud cost data across clusters and cloud accounts.
Access the CCM dashboards
To access the dashboards from the CCM module, perform the following steps:
-
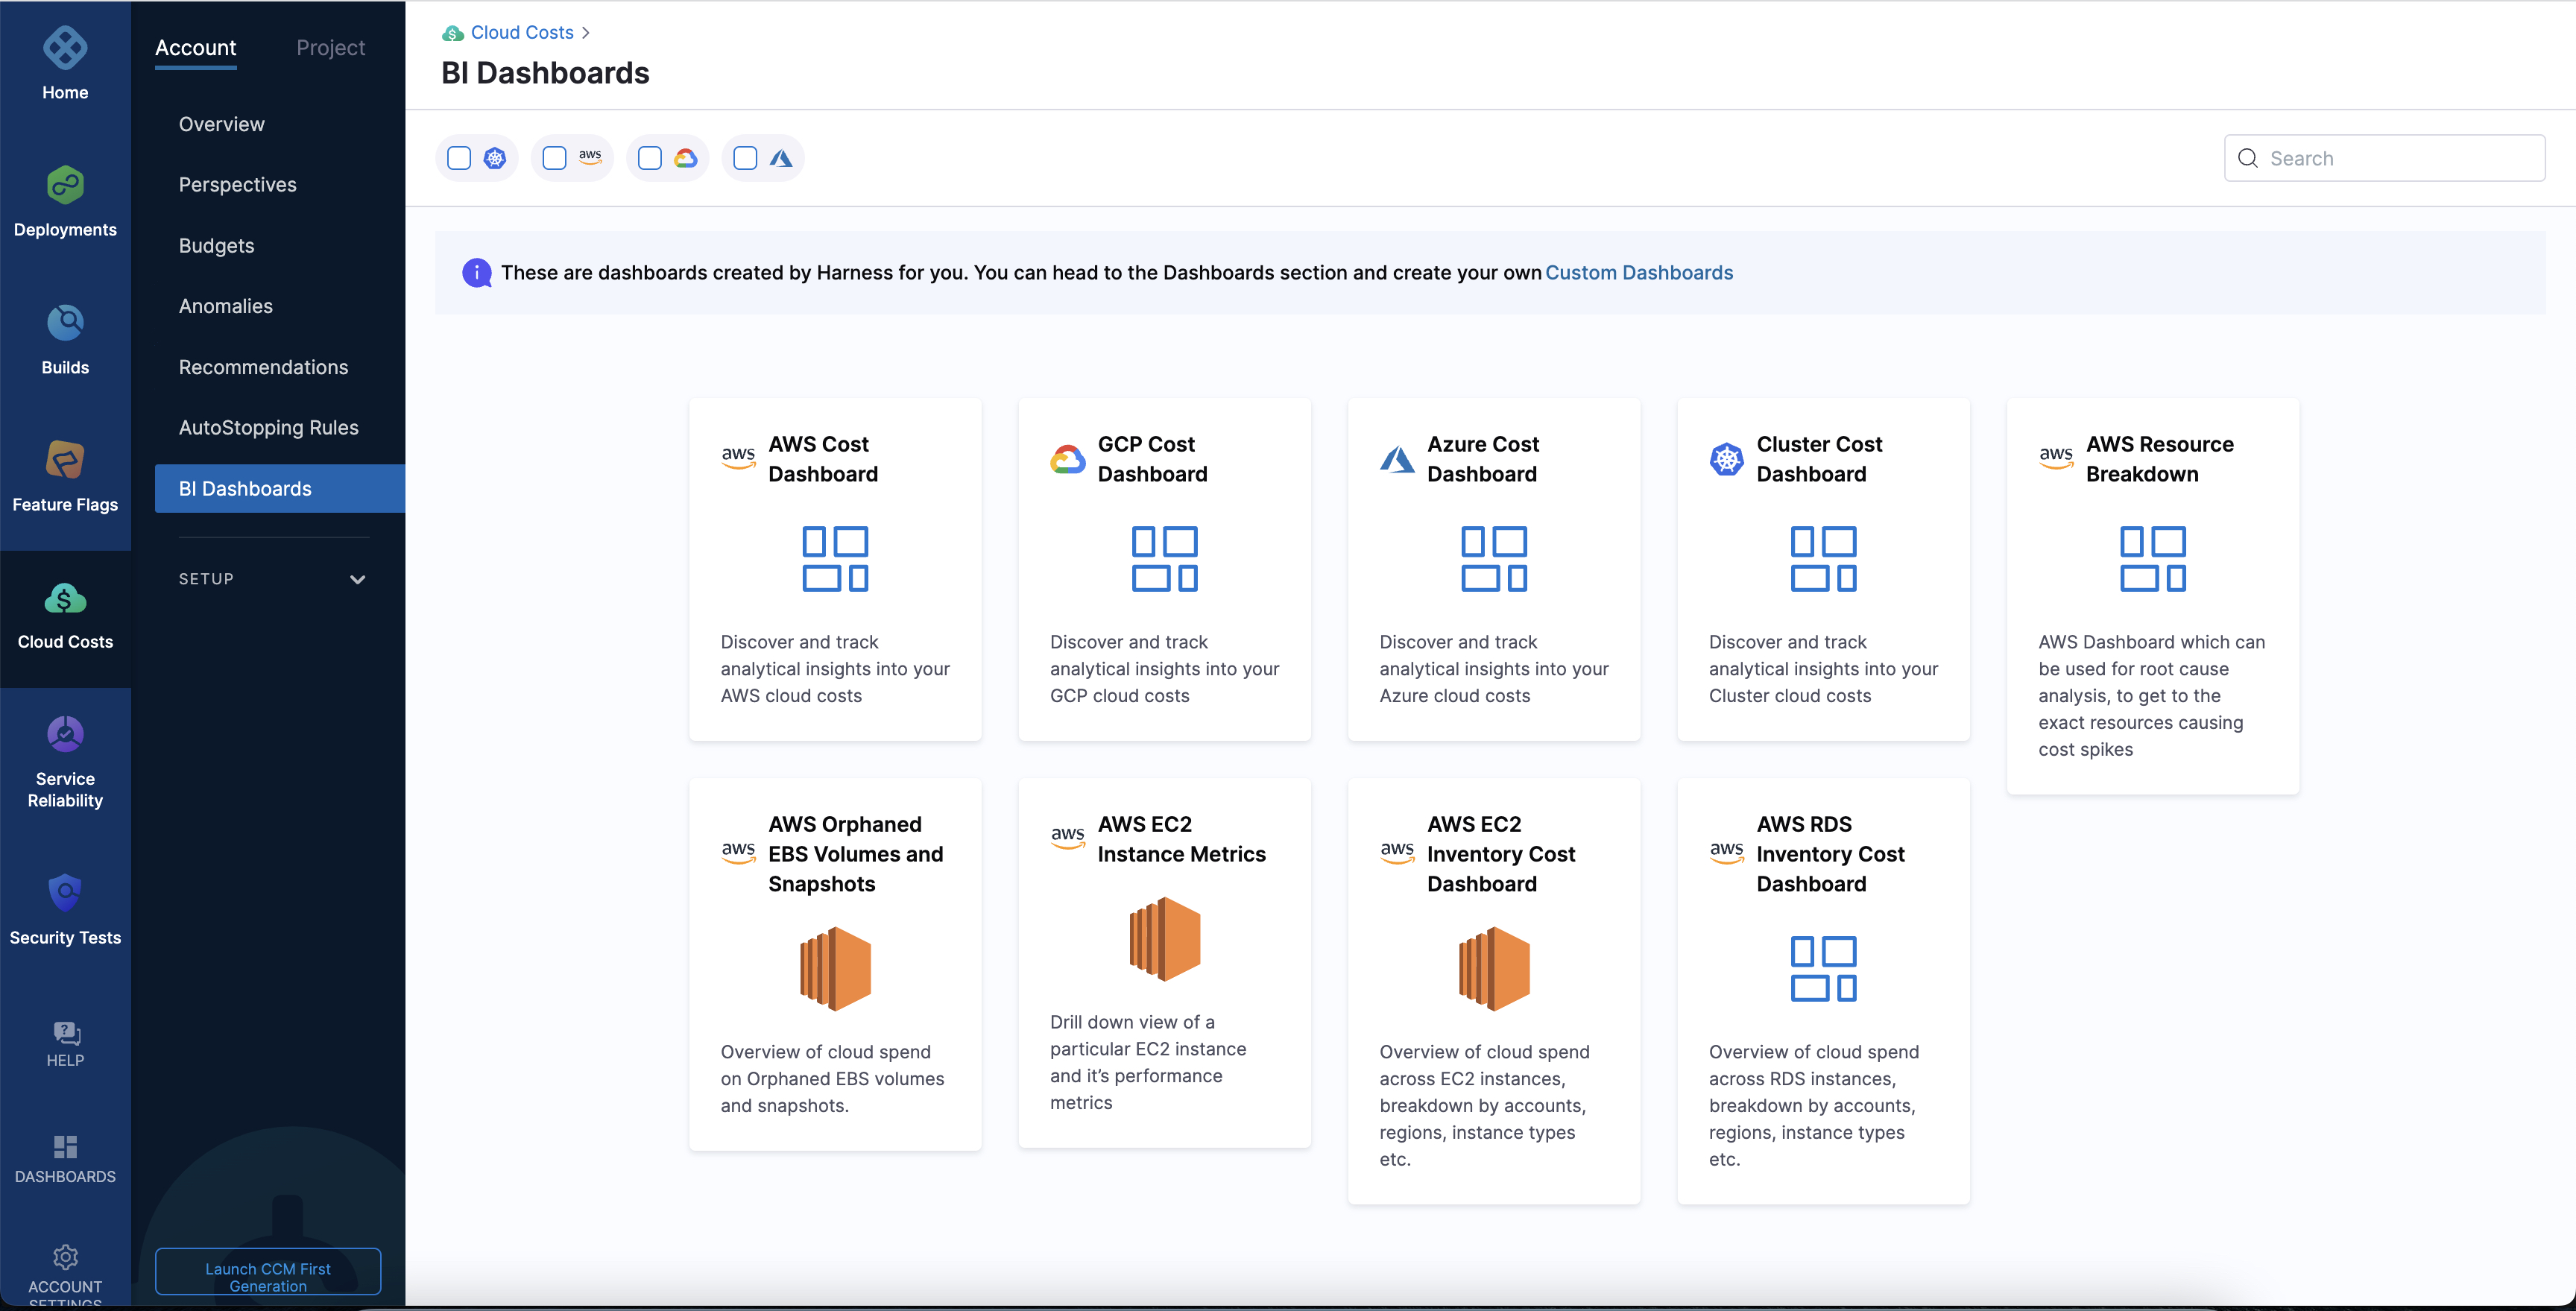
In the Harness application, click Cloud Costs.
-
Click BI Dashboards.
-
Select the cloud provider to view the dashboards available for the specific cloud provider.
-
Click the required tile.
The Dashboards page opens.
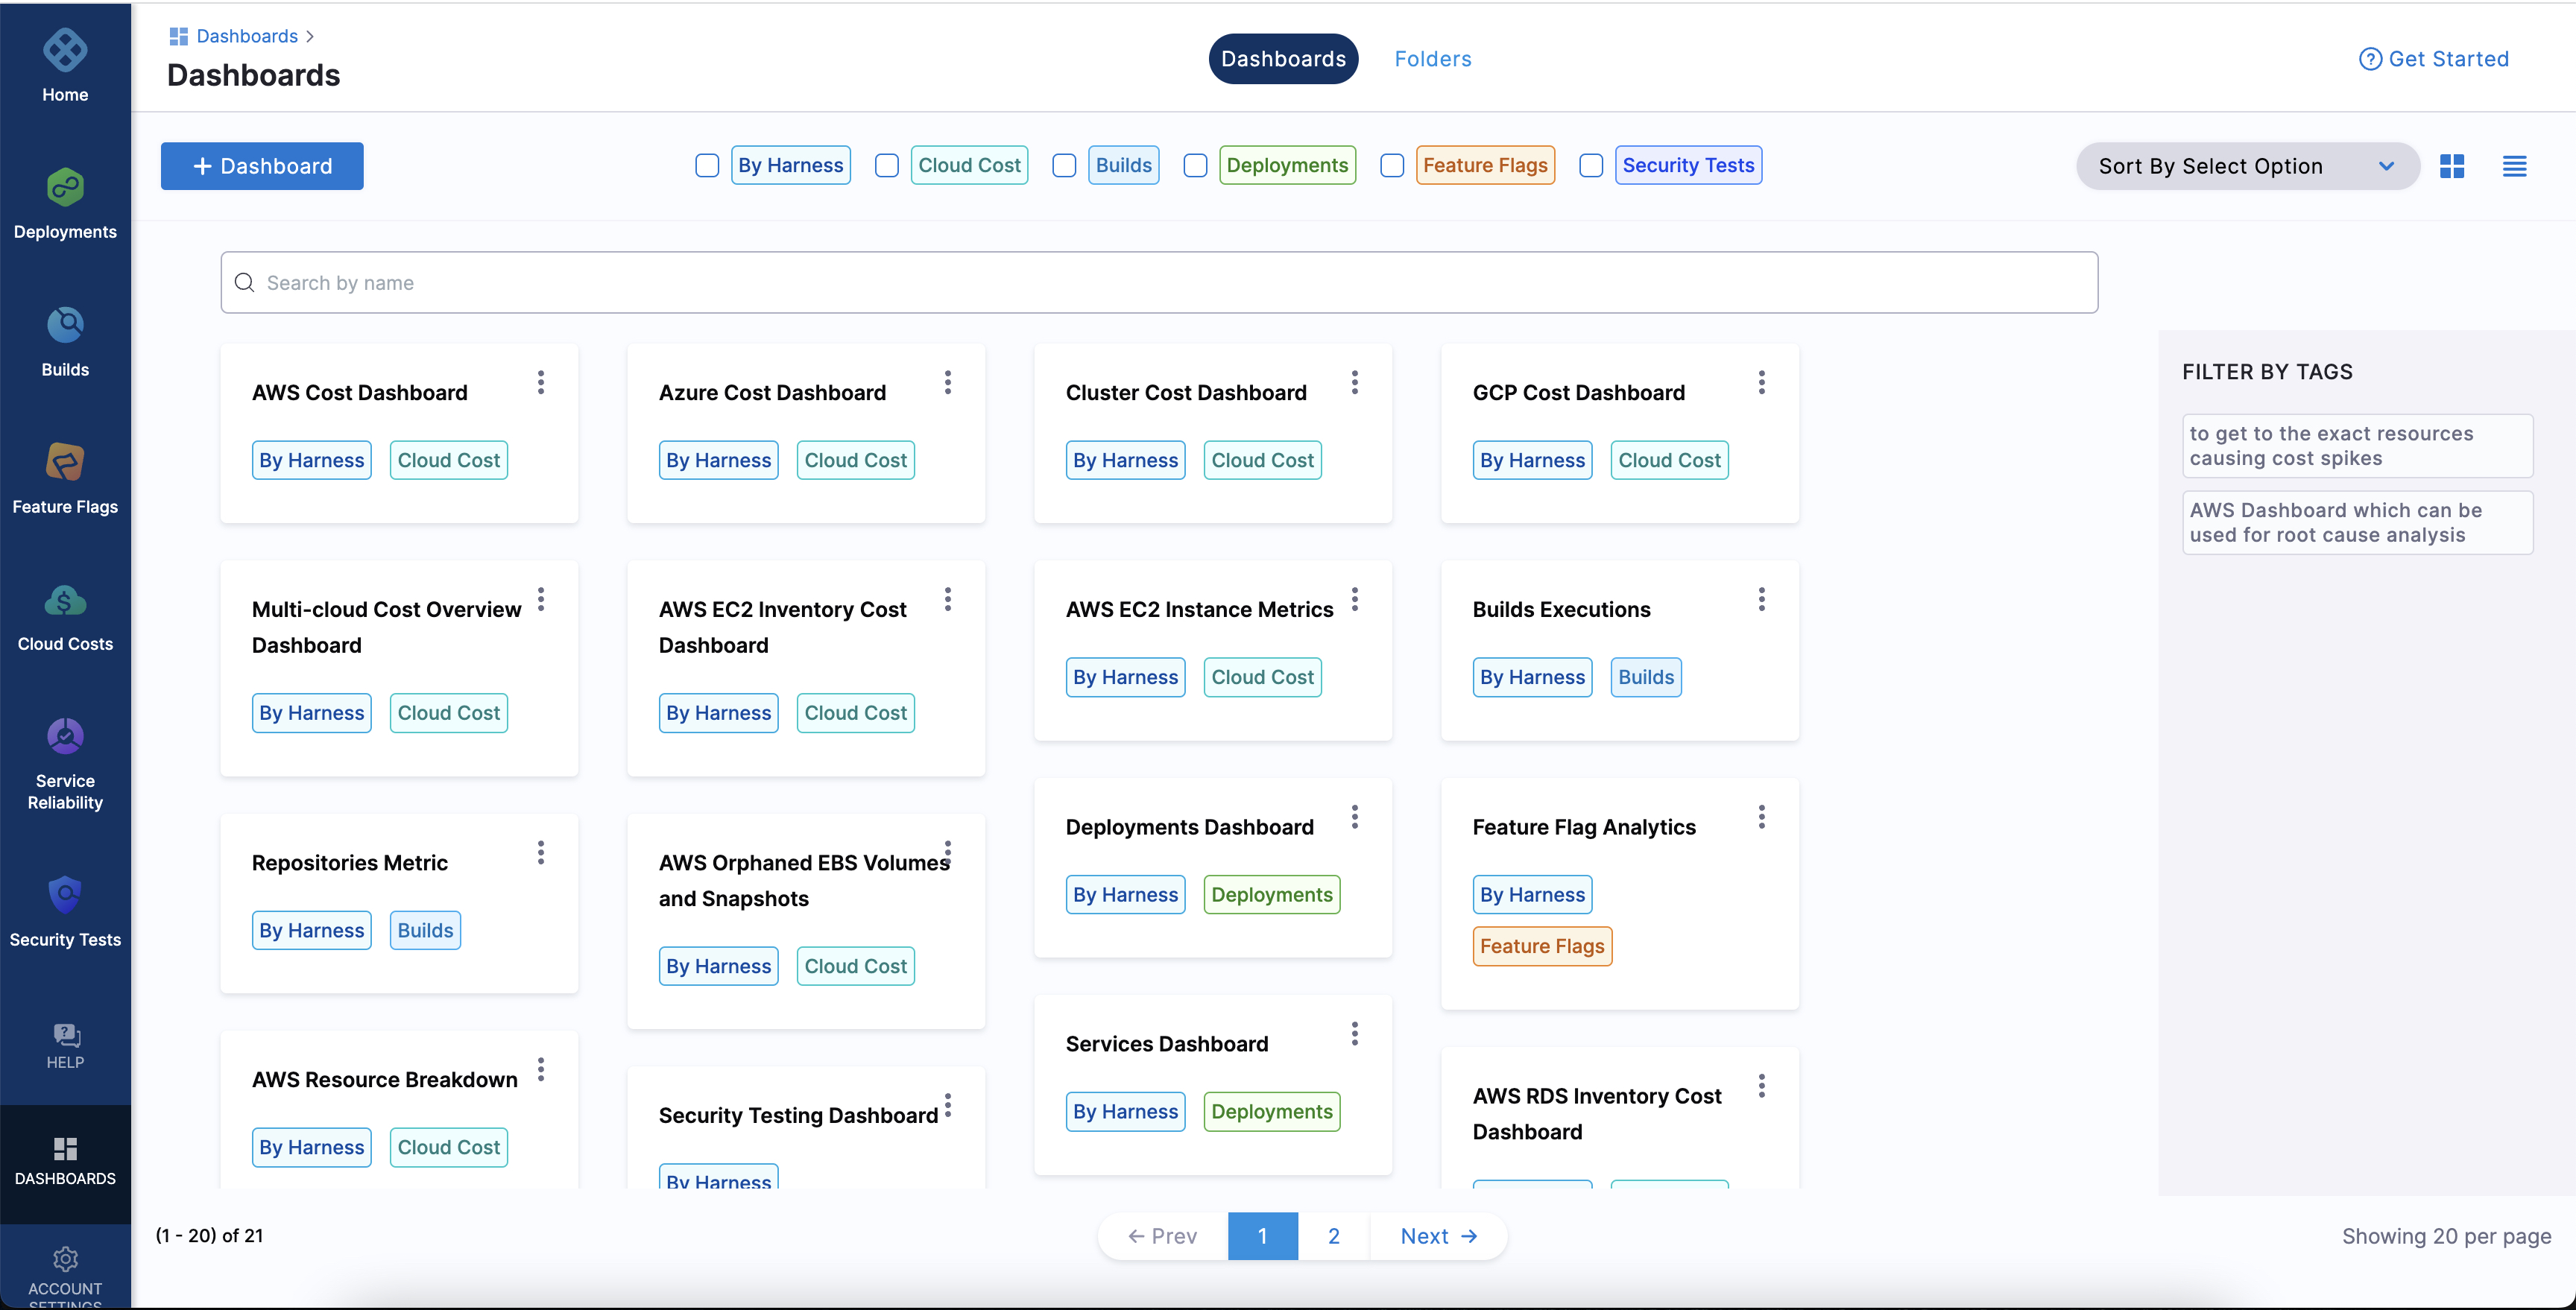
To access the dashboards outside the CCM module, perform the following steps:
-
In the Harness application, click Dashboards.
-
Select By Harness or Cloud Cost to filter the list.
-
Click the required tile to view the corresponding dashboard.
The data scan limit is 350 GB per query. Users can avoid hitting this limit by applying necessary filters to reduce the result-set as per their requirements.
Billing Export Fields Expansion in Unified Explore
We’ve expanded our billing data capabilities across all three cloud providers: AWS, GCP, and Azure by exposing all standard billing export fields directly in Unified Explore.
These fields allow for deeper visibility, granular filtering, and improved analysis of cloud spend across providers.
Managing cloud costs effectively requires access to detailed and accurate data. By exposing native billing export fields in Unified Explore, you can:
-
Filter and group data using familiar cloud-native terms
-
Perform cost attribution with greater precision
-
Simplify audits, budgeting, and forecasting
What’s Included
AWS
All standard fields from AWS Cost and Usage Reports (CUR) are now available.
Example fields: lineItem/UsageAccountId, lineItem/UsageType, product/instanceType, lineItem/UnblendedCost, and more.
GCP
Support for both Standard and Detailed billing export schemas.
Fields from cost_type, project.id, service.description, and more are available.
Azure
Standard billing dataset fields such as resourceGroup, meterCategory, costInBillingCurrency, etc. are now exposed.
Unified FOCUS Schema Mapping
Unified Explore now supports billing export fields aligned with the FOCUS v1.1 Specification. This brings consistency across cloud billing data, enabling standardized cost analysis and easier comparison across providers.
What is FOCUS?
FOCUS (FinOps Open Cost and Usage Specification) is a vendor-neutral schema that defines a standard format for cloud billing data. It provides a consistent data structure across AWS, GCP, and Azure, simplifying multi-cloud cost management.
Read more about FOCUS.
How to Use These Fields in Unified Explore
- Navigate to BI Dashboards → +Dashboard
- Click on Add Widget and choose Unified
- Use all the listed fields in filters, group-bys, or as columns in your reports